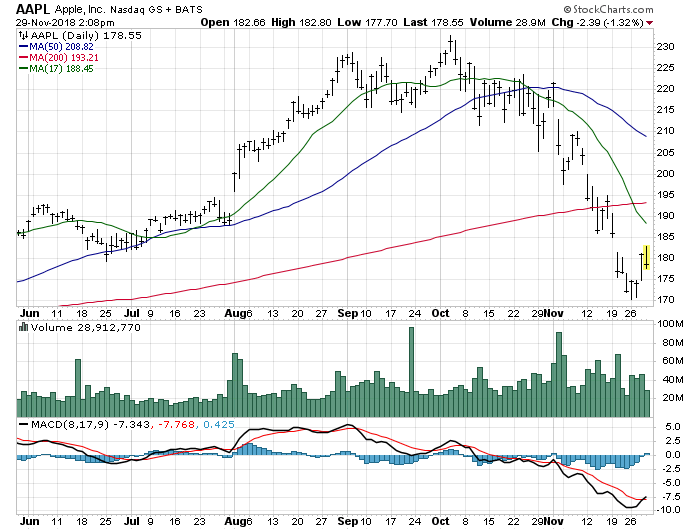
10-25-18 Take profits or protect with puts. Close to dropping to 190. At a very critical spot.
11-7-16 Buy target met at 108 range. Play bounce to the 114-122 range. Long term behavior is converging positive. Risk remains to 103.
10-20-16 Upside target met above 118. Long term behavior has confirmed positive, and established a new long term bull cycle. Accumulate at or below the 17 day axis. Support is building at the 104-110 range.
9-25-16 Buy and sell targets met(102.55-116.10)13% profit. Buy on pull back at or below the 17 day axis.
8-28-16 Hot Stock closed: Upside target met (108.74-110.20)1% profit. A triple convergence is forming this cycle. Buy at 97-103 on pull back.
8-1-16 Hot Stock update: The positive breakout is confirming with continued upside to the 110-120 range.
7-7-16 Hot Stock update Alert: Behavior is rotating positive with renewed upside buy signal.
6-15-16 Hot Stock update: Resistance met at the 510 axis. One more hard lean is indicated with risk to the 75-89 range. Utilize hard pull back to buy.
5-20-16 Hot Stock update: Buy target met at 89 range. A bottom reversal signal is generated with upside to the 98-106 range.
4-28-16 Hot Stock update: A FTF formation and gap down is in place increase risk of support breaking at the low 90 range. The gap down has extended time to the 5-7 cycles. Resistance met at 112.50 missing forecast.
4-13-16 Hot Stock Alert: The upside breakout alert is generating a strong signal.
3-11-16 Hot Stock update/ALERT: A bottom formation is confirmed with short term upside to the 108-114 range. Long term forecast remains to the 115-130 range.
2-16-16 Hot Stock update: A bottom reversal is indicated with upside to the 102-115 range. Buy target met at 91 range. Support is now at the low 90 range.
1-25-16 Hot Stock update: A FTS formation is in place along the 17 day axis. Risk is to the strong support range in the low to mid 70's. Midterm support is in the low 90's. The long term targets remain the same to the 120-140 range. Behavior is negative in all categories.
12-29-15 Hot Stock initiated(108.74): A Long term FTF formation is confirming. Buy target met at 105 range.
12-3-15 Buy target met. Resistance met at 204 day axis range. Close long make new decision(111-115.17)4% profit. Risk is to the 96-106 range. Buy on short term pull back.
11-9-15 Upside target met at the 204 day axis range above 124. Early signs of a long term bottom are forming. Utilize short term pull backs to accumulate. Strong support is building at the 100-110 range.
10-15-15 Upside target met above 116. Early signs of a FTF condition are developing. Risk remains to the 510 axis.
9-22-15 Upside target range met(100-116)16% profit. The long term negative convergence is in place with continued risk to the 90-1-3 range.
8-30-15 Buy target met below 100 on hard lean. Support met at long term support range in low 90's. A long term negative convergence is forming maintaining downside pressure.
8-7-15 Upside target met(122.85-132.30)8% profit. Behavior has shifted slightly negative on gap down condition. Risk is to the 100 range. Buy on hard pull back this cycle. Resistance will be at the 204 day axis.
7-12-15 Downside buy target met along the 204 day axis. Average cost should be below 126. A long term buy signal is generated with long term upside to the 130-150 range.
6-22-15 Short term risk has increased for pull back to the 204 day axis.
5-25-15 A FTF signal is generated with continued upside to the 135-160 range by year end.
4-29-15 Upside target met(124.95-134.50)8% profit. Buy on hard pull back to the 110-120 range.
4-6-15 A FTF formation is confirming with renewed upside to the 131-147 range.
3-16-15 Hot Stock closed: Upside target met (113.99-133.50)17% profit. A FTF signal is generated. New long opened at 124.95.
2-16-15 Hot Stock update: Upside side target met above 127 with continued upside to the 130-150 range.
1-23-15 Hot Stock update: A FTF formation is confirming. Behavior is accelerating positive. Buy target met at 105.
12-26-14 Hot Stock initiated(113.99): A FTF formation and upside breakout condition are indicated. Downside buy target missed and reversed at 106 range.
12-1-14 Upside target met(102.47-119.75)17% profit. A FTS signal is generated with short term pull back to the 92-105 range. Utilize hard pull back to buy.
11-6-14 Upside target is met at the 110 range with continued upside to the 112-122 range by year end.
10-21-14 Short position closed on FTF at the 95 range and gap up formation(99.18-102.47)3% loss. Long opened at 102.47 with renewed upside to the 107-115 range over the next 2-5 cycle
10-19-14 A negative convergence is in place. Risk remains to the 80-90 range. A possible upside reversal is being generated. Prepare to lock in profit on short play.
10-1-14 Exhaustion signal continue to develop along the 17 day axis. Risk is to the 78-86 range. This is a reasonable short entry point.
9-8-14 Hot Stock closed: Upside target met(95.99-103.70)8% profit on Hot STock and (97.19-103.70)7% profit on original. Look for FTF along the 51 day axis. Risk is to the 86-92 range.
8-15-14 Hot Stock update: Upside breakout confirming.
8-11-14 Hot Stock initiated(95.99): A strong FTF signal and upside breakout is generated. Risk is subsiding.
7-25-14 Update: Upside breakout is confirming.
7-23-14 A FTF signal is generating an upside breakout condition.
7-2-14 The 7:1 forward split is in effect. Upside target met above 665(95.00)..Long term behavior remains strong positive. However, there are risk signals to the 82-88 range .
6-5-14 Upside remains to the 650-700 range. Upside target met above 649.
5-8-14 Suretrade Closed: Upside target met (532.87-601)13% profit. Long term upside remains to the 620-700 range. Buy on pull back to the 520-560 range. A forward stock split is pending and worth holding and owning.
4-22-14 Suretrade update: A FTF formation and long term upside breakout condition is confirming.
3-23-14 Suretrade Initiated(532.87): A dual positive convergence is generating a long term upside breakout condition. Buy at 500-540 range with long term upside to the 600-700 range.
2-26-14 Upside target met(494-551)12% profit. Buy at 460-499 range on pull back.
2-4-14 Downside buy target met at the 490 range. Long term behavior remains positive but shows some exhaustion. Buy at on pull backs to the 450-510 range.
1-12-13 Buy and sell targets met(539-571)6% profit. Long term behavior is positive, but a double FTS signal was generated. Utilize short term hard pull back to accumulate at the 460-510 range.
12-15-13 Upside target met(521.14-575)10% profit. Utilize short term pull back to buy at the 490-530 range. Behavior remains positive.
11-21-13 A FTF alert is generated. Downside risk has subsided.
11-19-13 A FTS signal is generated with short term downside risk to the 460-500. Buy at 51 day axis. Long term behavior is shifting positive.
10-27-13 Hot Stock closed: Upside target met(448-533)19% profit on original and (487.96-533)9% profit on Hot Stock. Utilize short term pull back to buy. Long term forecast is to the 600-670 range.
10-1-13 Hot STock initiated(487.96): Downside buy target met below 450 on gap down formation. A Long term FTF formation is confirming and long term behavior is shifting positive.
9-5-13 A new long term Hot Stock formation is confirming. Accumulate at 450-490 range. Longer term upside to the 520-690 range.
8-10-13 Hot Stock closed: Upside target met(668-468)30% loss on original and (475-468)1% loss on average cost. Buy back for a reposition at the 400-440 range. Resistance met at the 204 day axis.
7-18-13 Hot Stock update: Resistance met along the 51 day axis after bottom reversing at the 388 range. Behavior is slowly shifting less negative which can generate false buy signal.
6-23-13 Hot Stock update: The final lean condition remains in place with continued risk into the mid 300 range. Upside support remains at the 430-460 range but shows signs of deterioration. Target average cost should be below 475 if a long term investor.
6-16-13 Hot Stock update: Short term risk has increased to the 350-399 range. Buy on hard lean.
5-19-13 Hot Stock update: Resistance met along the 510 day axis. Slope and behavior continue to improve towards the positive side.
5-6-13 Hot Stock update: The bottom reversal breakout remains in tact with continued upside to the 480-580 range.
4-30-13 Hot Stock update: The bottom reversal is confirmed with upside to the 480-580 range. This is a good entry for traders and investors.
4-21-13 Hot Stock update: a Final Lean condition is cycling through. Early signs of and extreme oversold condition are developing. Accumulate at 360-390 range and play bounce to the 435-475 range. Long term forecast is adjust to the 475-575 range.
3-27-13 Hot Stock update: Long term behavior is shifting positive. Utilize final pull back to buy at the 370-430 range.
3-3-13 Hot Stock update: A final lean condition is generated on a FTS at the 510 day axis. This is a final lean condition. Downside buy target is met below 430 with continued risk to the 370-420 range. That is the strong buy range for both trading and owning.
2-5-13 Hot Stock update: The bottom cycle is showing signs of completion. The extreme buy range is met between 370-450 range.
1-10-13 Hot Stock update: The bottoming cycle is completing. Resistance is at the 560 range and upside remains to the 550-680 range over the next 3-5 cycles.
12-17-12 Hot Stock update: Downside buy target met on lean to the low 500 range. Worst case lean is to the 400-460 range. This is the strong buy and ownership range. Long term forecast remains to the 700-low 800 range. Once the year end sell off is complete, expect a significant upside rally.
11-25-12 Hot Stock update: Downside buy target met on the hard lean at the 505 range. Sell on bounce to the 625-700 range and make new decision. Long term slope and behavior are shifting positive and accelerating. Long term upside remains to the 700-790 range.
11-14-12 Hot Stock update: Downside buy range met at the 533 range. EArly signs of the bottom reversal are developing.
10-28-12 Hot Stock update: The stock is hitting the FTF formation range. Strong buy at 525-605. Play bounce to the 650-700 range and make new decision. Downside buy target met at the 603 range. Support is along the 204 day axis and will trigger strong institutional buying.
10-22-12 Hot Stock update: a short term upside reversal and FTF signal are generated. Long term behavior and slope formation remain strong positive. Buy at 550-630 range on this pull back.
10-8-12 Hot Stock update: A FTS formation along the 17 day axis is in place increasing short term downside to the 204 day axis. Buy at 525-575 range on pull back. Support points are at 600/575/ and 525.
10-3-12 Hot stock initiated(668.68): A FTF formation at the 51 day axis generated yesterday and downside buy target met. Play bounce to the 700-750 range. Upside target met last cycle(680.44-705)4% profit.
9-9-12 Hot Stock closed: Upside target met(613.89-680-.85)11% profit. A FTF signal and positive breakout condition remain in place with with continued upside to the 700-740 and secondary extreme breakout is to the 775-820 range. New long opened at 680.44. Be prepared to take a short term profit this week.
8-14-12 Hot Stock update: Upside target is met above 638 with continued upside to the 640-680 range.
The positive opposing is increasing an upside breakout condition.
7-23-12 Hot Stock update: Expect increased volatility. Upon earnings two defined areas are defined. Upside is 630-680 range and risk to the 450-525 range.
7-22-12 Hot Stock update: The slope formation and behavior condition continues to be strong positive. Buy at 500- to the 17 day average. An upside breakout condition is in place and supports an upside move to the 630-680 range.
7-9-12 Hot Stock initiated(613.89): An upside breakout condition is generated with upside to the 640-680 range.
6-27-12 Upside target met(569.18-590)4% profit on original buy and (546-590)8% profit on the average cost. New long established to day at 574.50 with renewed upside to the 590-630 range. Slope formation has shifted positive and generated a positive convergence.
6-4-12 Downside buy target met at the 522 range. Resistance remains along the 51 day axis. Short term slope and behavior are negative, but long term behavior is strong positive. Average cost is (523+569)/2=546
5-9-12 Buy and sell target ranges met(555-618)11% profit. A negative convergence is increasing short term downside pressure. Long term behavior and slope formation are strong positive. Early signs of an upside reversal are beginning. Establish long below 570 range. Strong buy at 450-515. New long opened today at 569.18.
4-15-12 Upside target met at 644. A short term peak formation and FTS signal are generated with risk to the 475-550 range. Long term behavior and slope formation are strong positive. Utilize pull back to buy at the 475-555 range for bounce above 600.
3-21-12 Upside target met above 600. Utilize short term pull back to buy at the 500-550 range. The stock is slightly overextended.
2-27-12 Upside target exceeded(459.68-428)7% profit. There is continued upside as slope formation is accelerating positive. Buy on pull back below 500.
2-5-12 A FTF signal is generating with continued upside to the 460-490 range. Re establish long and accumulate at the 420-459 range.
2-2-12 Upside target met on gap up formation(424-458)8% profit. Mild exhaustion is indicated and a mini FTS signal is generated increasing short term downside pressure to the 410-430 range. Long term behavior is strong positive.
1-24-12 A FTF formation is confirming along the 17 day axis. With continued upside to the 440-480 range. The slope formation is accelerating strong positive.
1-11-12 Hot Stock Closed: Upside target met(393-427)9% profit on Hot Stock and (363-427)18% profit on original buy. Buy at 390-410 with continued upside to the 430-450 range.
12-29-11 Hot Stock update: The FTF formation remains in place and a positive convergence has confirmed with continued upside pressure to the 410-430 range. Buy on pull backs to the 370-390 range.
12-11-11 Hot Stock initiated(393): A FTF formation and positive breakout condition are indicated.
12-4-11 A long term FTF formation is developing. The buy target was met along the 200 day axis.
11-7-11 Upside target met on gap up(375-426)14% profit. Buy on pull back to the 360-380 range. The stock is consolidating along the 50 day axis with short term risk to the 360-389 range. Long term behavior remains strong positive, but early signs of exhaustion are developing.
10-13-11 Downside buy target met. A long term FTF formation along the 200 day axis is in place. Sell on surge to the 415-440 range.
9-20-11 Upside target met(355.05-422.85)19% profit. Buy at 380-405 range on pull back. Behavior remains strong positive.
8-29-11 A double FTF formation is in place along the 50 day axis. Downside buy target met at the 350 range with continued upside to the 400-425 range. This is now a positive opposing force formation.
8-4-11 Upside target met above 400. Utilize short term pull back to buy at the 350-375 range.
7-19-11 The long term positive opposing confirmed and generated the upside breakout above 375 with continued upside to the 380-420 range.
7-13-11 Upside target met(343.26-360)5% profit. A positive long term opposing force is forming. Buy at 335-350 range on short term pullback. The stock is positioning for an upside breakout to the 360-390 range.
7-4-11 A FTF formation is confirming and reducing downside risk. Buy at 320-344 range. An upside breakout is forming with renewed upside to the 350-380 range.
6-25-11 The stock is exhausting and slope is shifting slightly negative. Close long position and make new decision. Risk is to the the 280-300 range. Utilize pull back to reposition on long side. Average cost(326-326.35) Even and (332-326.35)1.8% loss on original buy.
6-1-11 The stock is positioning for an upside breakout. Buy at 320-340 on pull back.
5-8-11 Downside buy target met at the 320 range. A positive convergence is confirming supported by strong positive long term behavior. Average cost is (332+320)/2=326...
4-12-11 Upside target met(338.61-354.30)5% profit on original and (332.46-354.30)7% profit on average cost. New long opened at 332.40 today. A bottom reversal formation is developing as slope formation is shifting positive. Raise buy range to the 310-332 range.
3-19-11 A FTS was generated at the 360 range missing the upside target. Slope formation has shifted slightly negative increasing short term downside pressure with risk to the 300-320 range. Buy on final downside lean and adjust upside target to the 350-375 range. downside buy target met at the 326 range. Average cost is (326.30+338.61)/2=332.46
2-23-11 Downside buy target met below 340. The stock indicates a FTF condition but will remain volatile.
2-10-11 The high end of the upside target met today at 360. Expect increased volatility and a short term profit taking cycle. Buy at 315-340 range on pull back. Mid term forecast is increased to the 375-400 range.
1-31-11 Upside target met(319-348)9% profit. The stock has generating FTF and FTS signals during the last cycle. Expect continued volatility. Accumulate at the 310-330 on pull backs.
1-9-11 The FTF confirmed below 320 and the stock has entered the low end of the price target range above 330. A positive opposing force formation is in place with continued upside to the 340-360 range. This is a final stage upside breakout. Prepare to lock in profits.
12-13-10 PRo17 indicates a FTF formation with continued upside to the 325-360 range. Accumulate at the 310-320 range.
12-7-10 Hot Stock Closed: Pro17 indicates upside target met(316-323.99)3% profit on HS and (301-323.99)7% profit on original buy and 8% profit on average cost. Buy on short term pull back to the 290-306 range.
11-29-10 Hot Stock initiated: PRo17 indicates downside buy target met below 298. Average cost is(298+304)/2=301. The stock is positioned for an upside breakout. stock is at 316 range on HS buy signal.
11-15-10 PRo17 indicates short term downside pressure. Prepare to buy stock at the 280-300 range on this little lean. Downside buy target met below 304.
11-11-10 Pro17 indicates consolidation cycle is completing. Buy at 295-315 range to re establish long position.
11-7-10 Pro17 indicates low end of upside met(275-320)16% profit. Buy on pull back to the 290-305 range. Short term exhaustion is indicated, but long term forecast remains to the 320-360 range.
11-1-10 Pro17 indicates continued consolidation. Buy at 270-290 on hard pull back. Long term forecast is to the 320-360 range. support is building at the 250-280 range.
10-19-10 Pro17 indicates a mini FTS at the 319 range missing best case target range. It is prudent to lock in profits and make new decision. Buy at 270-295 on pull back.
10-15-10 PRo17 indicates upside target range met above 310, Maintain long position.
10-7-10 PRo17 maintains upside forecast to the 310-340 range.
10-5-10 Pro17 indicates downside buy target met at 275. A FTF is in place and an upside breakout is in place. The stock will set significant new highs.
9-27-10 Pro17 indicates upside target met(240.50-294)22% profit. Buy on pull back to the 265-280 range. Upside target is 310-320.
9-20-10 Pro17 confirms upside breakout. The stock will set new high. High target is 320-350.
9-15-10 Pro17 is raising buy limit to the 250-270 range. Positive breakout confirming.
9-13-10 PRo17 indicates a strong positive slope shifting generating a positive breakout conditions for new highs in the stock.
9-7-10 Pro17 indicates a mini FTS signal. It is prudent to lock in profit and buy on pull back to the 235-250 range. The current position is up 7%.
9-5-10 Pro17 indicates downside buy target met at the 240 range. A long term FTF is in place with continued upside to the 265-280 range.
8-27-10 PRo17 indicates a mini FTF signal at the 235 range today. Long term behavior remains strong positive. A bottom reversal is indicated. Top end buy limit is raised to the 230-240 range.
8-23-10 PRo17 indicates a FTS signal and negative convergence. Protect principal. Long closed(246.20-245.80)even. Upside target missed 255 at 254.67. This is a reasonable short term short. Pro17 suggests waiting for sell off and buying on FTF signal.
8-16-10 PRo17 indicates a mild negative convergence allowing for the stock to have a short term downside lean to the 200 day range. Buy on this pull back give the chance.
8-12-10 PRo17 indicates downside buy target met at the 246 range. Buy at 220-235 on a hard pull back. The stock is still vulnerable for a sell off to the 200 day average. The positive convergence is mildly preventing short term failure.
7-29-10 Pro17 maintains condition from 7-21 forecast. Bias is shifting more positive. Best buy is at the 225-245 range. A positive convergence is forming but is in conflict with a slightly negative slope, maintaining continued volatility.
7-21-10 Pro17 indicates significant conflicting indicators. A negative convergence is in place and long term slope formation is strong positive. Buy at 215-225 and sell at 275 for short term. Long term upside is above 300. Expect continued volatility between 245-275. Wait for a FTF to confirm before committing to a long position. Risk remains to the 200 day average. Extreme volatility is to continue.
7-13-10 PRo17 indicates a FTS formation at the 17 day range. This has caused a negative slope shift and increases downside risk in the short term to the 215-230 range. A short is speculative and carries above average risk. Buy on hard pull back to the 215-225 range. Watch for updates.
7-7-10 Pro17 indicates an upside reversal at the 244 range. A positive convergence remains in place support upside reversal to the 265-280 range.
6-30-10 PRo17 confirms continued downside pressure. Risk remains to the 210-225 range. This is the strong buy range. Let the stock complete the FTS cycle before buying stock. Support is at 205-220 range. If short, prepare to lock in profit in the next 3-7 trading days.
6-27-10 Pro17 indicates continued short term downside pressure. Wait for a FTF formation to confirm in the 230-250 range. Long term behavior remains strong positive.
6-23-10 Pro17 indicates mild exhaustion in upside breakout. Upside target met(260-279)7% profit. Risk remains to the 230-255 range. Long term behavior remains positive and will support a strong FTF formation. Short play is possible in the very short term.
6-23-10 Pro17 indicates upside target met(259.69-279)7% profit. Be patient on buy side until a FTF is generated. A short play
6-15-10 Pro17 indicates a FTF signal, positive short term behavioral convergence, and positive slope shift. Close short and establish long.
Short closed(260-259.69)even on original and 3% loss on average cost(251.51-259.69). Long established at 259.69 range. There is renewed upside to the 270-300 range to set an all time high.
6-9-10 Pro17 confirms the FTS at the 265 range. A negative convergence has formed with increased downside pressure to the 210 range. Short opened at 243.20 and 260.00.. Average cost is (243.20+260)/2=251.50 on short position. Buy on hard pull back to the 190-220 range.
6-1-10 PRo17 confirms the FTF at the 235 range and upside target is met above 260. EArly signs of short term exhaustion are developing. Buy at 210-230 range. A short is developing but not confirmed yet.
5-23-10 Pro17 indicates short target met(265-235)11% profit. The stock is in the neutral range at 235-245 range. Early signs of a FTF formation are developing but not confirmed. Buy at 210-225 range.
5-16-30 Pro17 indicates buy target met at 230 and upside met at 262(230-262) 14% profit on May 7th. Short target met at 265 on March 8th. A secondary FTS is indicated increasing short term downside risk to the 215-235 range. Prepare to lock in profits quickly.
Significant volatility remains the norm.
5-6-10 Pro17 indicates short target met(258.68-210)19% profit. Long position opened at 210. Close long position(210-246.25)17% profit. What a Day. New forecast, short at 255-270 and buy at 205-230 range.Long term behavior is strong positive. Expect extraordinary volatility over the next 2 cycle.
5-4-10 Pro17 indicates a mini FTS signal with increased downside risk to the 220-240 range. Short at 258-270 range for short term pull back. Go long at the 210-235 range.
4-27-10 Pro17 indicates upside target met(248.92-271)9% profit. Buy at 220-240 on pull back. The stock is overextended. Long term behavior is strong positive.
4-15-10 Pro17 confirms FTF at the 235 range. The stock is generating an upside breakout to the 250-290 range.
4-1-10 Pro17 indicates position opened on FTF at the 220 range. Lock in profits. Mild exhaustion is indicated. Buy on pull back to the 225-229 range. Support is building at the 210-220 range. Position closed(221-236)7% profit. The stock is positioning for an upside trend to the 250-299 range over the next 4-7 cycles.
3-14-10 Pro17 indicates a short term peak formation. Lock in profit and make new decision(198.67-226.60)14% profit. Buy on pull back to the 205-215 range. This is a 2-7 day pull back. Be prepared to buy on FTF formation.
3-10-10 Pro17 indicates upside target met. A positive convergence is in place supporting upside move. Current position is up 13%. prepare to lock in profits.
2-21-10 Pro17 indicates a mini FTS signal. Utilize short term pull back to the buy stock at the 185-195 range. Upside breakout conditions are still in place but there is 1-4 days of resolve to get through before breakout resumes.
2-16-10 Pro17 confirms FTF and indicates a positive breakout condition. Buy up to 205.
2-11-10 Pro17 indicates a FTF formation and upside reversal. Slopes are shifting positive.
2-1-10 Pro17 indicates a short term bottom. Close short(197.75-194.73)2% profit and make new decision. there is upside to the 203-206 range on this bounce.
1-31-10 Pro17 indicates continued downside pressure. Slopes have shifted negative and risk is to the 170-185 range. Prepare to lock in profits on short in the short term.
1-22-10 Pro17 indicates a critical support range violated today. There is continued downside pressure to the 170-190 range. A short term short trade is a viable trade. see notes from 1-18. Be cautious on short side, a FTF can develop intraday over the next 2-6 trading days. short at opened at 198 range today.
1-18-10 PRo17 indicated a short term FTS formation with increased risk to the 175-190 range. this is a general market condition and protecting principal is the decision at this stage of the cycle. Position closed(204-205.93)1% profit. Buy on hard pull back to the 175-190 range. Pro17 will update on FTF signal.
1-14-10 PRo17 indicates downside buy target met at 204. There is an underlying positive convergence is place support the stock at the 202-208 range. The stock indicates continued signs of short term weakness. Buy at the 200-205 range in the short term. Worst case risk is t to the 175-190 range. Overall the stock continued to be positive long term. Buy on pull backs.
1-3-10 Pro17 indicates upside target met (189-214)13% profit. The positive breakout confirmed and there is an underlying positive convergence in place. Buy at the 202-208 range with upside to the 215-230 range. Early signs of a FTF formation are developing. Prepare to buy stock.
12-23-09 Pro17 indicates continued upside pressure and a positive breakout formation is developing.
12-22-09 Pro17 indicates downside target was met at the 189 range. The stock has generated a strong FTF formation and upside reversal and is positioned to move to new highs in the 205-225 range.
12-1-09 Pro17 indicates a mini FTS formation at the 202-203 range. Buy at the 186-196 range. See notes from 11-30-09
11-30-09 Pro17 indicates upside target met (186-208)12% profit. The underlying behavior and slope formations are positive. Utilize short term market weakness to buy stock over the next 2-5 trading days.
11-10-09 Pro17 indicates continued positive bias. All slopes are positive and behavioral strength is solid positive. Buy on pull back to the 187-197 range.
11-6-09 PRo17 indicates a FTF formation. The stock is at its resistance point. Slopes are positive and there is renewed upside to the 200-225 range. There is still underlying risk to the 175-185 range.
11-2-09 Pro17 indicates downside buy target met at 186 range today. Signs of a bottom are forming but not confirmed. There is long term support at the 140-150 range. Key support is at the 165-175 range. Look for an FTF formation at the 180-185 range.
10-26-09 Pro17 indicates a FTS formation above 205(184.90-205)11% profit. All slopes are positive.There is a gap up in place. Short term downside risk is to the 181-195 range. Buy on pull back to the 180-194 range. Pro17 is watching for a FTF formation.
10-20-09 Pro17 indicates a Gap up formation. All slopes are positive. Target is met above 200 for 7-9% profit. Maintain long position until a FTS formation develops.
10-4-09 Pro17 indicates a FTF formation. Buy less than 185. Best buy is at the 165-171 range. this is not a strong buy signal due to current market conditions.
10-1-09 Pro17 indicates upside target met (164-188.50)15% profit. Buy on pull back to the 161-171 range.
9-13-09 Pro17 indicates conflicting short term indicators with continued risk to the 150-160 range. Protect principal for short term. When the FTF formation confirms stock will break to the 180-200 range.
9-9-9 Pro17 indicates downside buy target met at 164 range. All slopes are positive but there are signs of mild exhaustion. This increases short term risk to the 150-160 range.
8-24-09 Pro17 indicates mild exhaustion in upside move. Buy on pull back to the 155-164 range. All slopes are positive, but stock could suffer in short term market pullback.
8-18-09 Pro17 indicates a mini FTF formation. Best buy is 150 given the chance. Long term behavior supports upside move.
8-4-09 Pro17 indicates mild exhaustion in up cycles. Stock is on track to reach 180-200 range. Buy on pull back to the 155 range. Best buy is 145-150 range. All slopes are positive.
7-30-09 Pro17 indicates a strong FTF formation at the 135 range and a secondary FTF at the 160 range. The stock is in a breakout mode and has continued upside to the 180-200 range. There is minimal risk to the 130-140 range. Buy on pull back.
7-7-09 Pro17 indicates a FTS formation and a short term negative cycle. The prime objective is to protect principal. Buy at the 120-125 range. If stock breaks 120 prepare to buy at 110. The stock has not generated the strong sell signal yet. but downside pressure is increasing and the stock has short term risk. Use this inefficiency to buy on hard pull back. A key support range is at 134 and it signal this will be tested. Protect principal and make new decision. Slopes are shifting slightly negative creating a short opportunity. A FTF can form at 134 so be cautious if playing short side.
6-24-09 Pro17 maintains forecast. see notes below
6-23-09 Pro17 indicates a bottoming process is nearly complete, however Short term slopes are slightly negative increasing downside risk to the 120-125 range. Buy more on hard pull backs to the 117-125 range.
6-9-09 Pro17 indicates a short term peak pattern. It is ok to take profits at this level and buy on pull back to the 125-135 range. Upon the FTF formation a new buy with upside to 150-160 will develop very quickly which is also a signal to hold stock if not trading. Pro17 is locking in profits and will buy on pull back. Last forecast (110-145)32% closed.
6-1-09 Pro17 confirms upside breakout formation with upside potential to the 160-180 range. Sell at top of range and make new decision.
5-27-09 Pro 17 indicates downside target was met less than 120 and a Strong FTF formation confirmed. Stock has formed an upside breakout formation creating upside potential to the 150-160 range. 170-180 is best case over the next 3 cycle. The long term behavioral convergence is confirmed and all slopes have shifted positive.
5-12-09 Pro17 indicates a short term pull back to the 115 to 120 range. A long term positive behavioral convergence is occurring support the stock firmly at the 112 range. Look for a FTF formation in the next 3-5 days and a new buy signal.
4-26-09 Pro17 indicates slight exhaustion. Buy on pullback to the 115-120 range. Upside is now at the 140-150 mark over the next 2 cycles. Slopes are positive. Look for one pull back to the 115 range before long term behavioral convergence.
4-6-09 APro17 indicates the stock is at its resistance level. This is where the stock can breakout and run or fail and pull back to the 100 range. Bias is positive but indicators are showing mild exhaustion. Stock is strong as slopes are positive.
4-2-09 Pro17 indicates a FTF formation and a renewed upside breakout. There is significant resistance at the 120 range with a probability to
form a FTS formation or release to 140.
4-1-09 Pro17 indicates short term exhaustion. A positive convergence is in place and support is at 95. Buy at 95 and sell at 120. Stock is neutral at 105.
3-25-09 Pro17 is indicating signs of exhaustion. There is risk to the 92-95 range. Take profits at this point. The stock can fail rapidly to the 100 range.
3-23-09 Pro17 indicates the stock is releasing to the upside, there is continued upside momentum to the 120 range. Take profits at this point. The stock can fail rapidly to the 100 range.
3-18-09 Pro17 indicates a peaking pattern. There is upside to the 110 range. But the stock looks a little tired. Expect continued volatility. The stock generated a Failure to Failure and has now converged positive so down side risk has moved up to the 92 range.
3-3-09 Pro17 indicates same forecast as 3-1-09
3-1-09 Pro17 indicates a strengthening Failure to succeed formation. Slopes are negative. 88 is the neutral point. The stock is exhibiting conflicting behaviors and is shifting to a negative bias. There is upside to 94 and downside to 80 in the next 5-7 days.
2-23-09 Pro17 indicates continued downside short term pressure. Slopes have shifted negative but positive convergence is still in place. Next downside stop point is the 80 range. Pro17 bought some at 92 and is looking to add at 80 if given the chance. There are two more days of downside pressure.
2-18-09 Pro17 UPDATE indicates a very short term downside pressure cycle due to market conditions. This creates a buy opportunity between 92-95 range.
2-16-09 Pro17 indicates upside reversal supported by a positive behavioral convergence. There is minor downside risk to 96 but that is in the buy range.
There is upside to 110 in the remainder of this cycle and best scenario upside to 120-130 range in the next cycle.
2-12-09 Pro17 indicates a Failure to fail formation FTF, This is support by a positive behavior convergence and strong positive slope shift. 100 was the last target price met. There is upside to 110 if it breaks 110 the stock will begin a climb to 125-130 range.
2-5-09 Pro17 upside reversal and continued positive slope shift. There is upside to 100 through remainder of cycle.
1-22-09 Pro17 indicates a short term upside reversal after a 9 day push to its support range. This is a short term rally so trade quickly.
1-15-09 Pro17 indicates continued negative slope and negative trend. There is 2-5 more days of downside pressure, however,
the stock appears to be bottoming between 80-85. The stock can reverse upside quickly in the next 4 trading days.
1-8-9 Pro17 is indicating a mild sell off to the 85-87 range. 90 is the neutral point to trade from. This should be a short sell off and stabilization.
12-26-08 Pro17 indicates AAPL has met both sides of its channel. There is short term upside to the 93-95 range. The major human behavior factors are negative slope and negative trend, however, with a rise to the 93 range a positive slope shift can occur and create an upside reversal.
Expect a channel to form between 85-95 for the next 17 day cycle. NOTE: if a negative report is issued on this stock it can gap down to the 60-70 range at any given time. That is the worst case scenario lingering.
|