| Basic Details |
| Stock: |
Tesla Motors |
| Symbol: |
TSLA |
| Current Price: |
$155.17 |
| Current Trend: |
short term bottom signal |
| Recommended Action: |
buy at 130-155 |
| Price Target: |
$170-205 |
| Other Details: |
2-16-16 Buy target met on hard lean to the 141 range. Play bounce to the 170-205 range.
1-25-16 Hot stock closed: Upside target met(227-243)7% profit.Resistance met at 243 and a gap down formation is in place. short term risk is to the 150-180 range. This is a buy zone. Hard risk is to the 115-130 range. Long term forecast remains to the 275-350 range. Utilize pull back to buy for long term position.
12-29-15 Hot Stock alert: The FTF formation and an Upside breakout condition are generated. Long term upside in 2016 is to the 350 range.
12-3-15 Hot Stock update: The short term upside target met(227-238.50)5% profit. Long term forecast remains to the 255-300 range.
11-15-15 Hot Stock update: Resistance met at 234 range. Risk of a hard lean is in place with risk below 180 range.
10-16-15 Long term Hot Stock initiated(227): A long term FTF signal is generated. Risk remains to the 185-210 range. Play bounce to the 240-270 range.
9-23-15 Upside target met(200-271)36% profit. Buy on short term pull back. Upside remains to the 270-290 range.
8-31-15 Buy target met at 510 day axis. Lock in profits at the 250-270 range this cycle.
8-7-15 Upside target met above 286. Long term behavior is positive buy at the 510-204 day axis range.
7-12-15 Upside target met above 282 range. Utilize short term pull back to buy. Long term upside is to the 300-450 range over the next 1-2 years.
6-22-15 Upside target met above 264. The long term convergence set a long term bull market in place for the next 1-2 years.
5-27-15 Support met at 220. A long term positive convergence is forming. Buy on pull back to the 204 day axis.
5-1-15 Upside target met(188-238)27% profit. Buy at 195-217 range. Strong support is at the 183 range.
4-10-15 A hard bottom reversal and positive breakout condition are forming.
3-16-15 Downside buy target at the 187 range. An upside reversal signal is generated. Resistance is at the 200-210 range. Upside is to the 210-230 range.
2-17-15 Upside target met (193-225)16% PROFIT. Behavior is still bias to the negative side with risk to the 125-175 range.
1-23-15 A long term negative convergence will maintain downside pressure. Behavior is neutralizing.
12-26-14 Downside buy target met below 193. A strong upside reversal signal is generated with renewed upside to the 235-265 range.
12-2-14 Upside target met(241-260)8% profit. Ris is to the 180-210 range this cycle. Be patient on buy side.
11-6-14 A FTF formation is confirming along the 204 day axis. Resistance is along the 51 day axis..
10-12-14 A Gap down condition has increased risk for a hard sell off to the 180-220 range. Utilize this hard pull back to accumulate. Wait for FTF signal to buy.
9-17-14 Upside target met above 291. Utilize short term pull back to accumulate at the 204 day to 51 day axis.
8-21-14 Hot stock closed: Upside target met (228.92-267)17% profit. Utilize short term pull back to 200-235 range.
7-30-14 Hot Stock status again(228.92): Buy up to 230, There is risk this cycle to the 180-200 range.
7-8-14 Hot Stock Closed: Upside target met(211.56-244.45)16% profit. A FTS is generated with renewed risk to the 150-190 range.
6-12-14 Hot Stock update: Accumulate at 180-211. The positive convergence is confirmed and long term behavior is confirming positive..
5-27-14 Hot Stock initiated(211.56): A FTF formation is confirmed and an upside breakout condition is indicated. Long term forecast is to the 275-360 range.
3-8-14 Upside target exceeded(117-265)126% profit. Utilize short term pull back to buy at the 180-220 range. Long term behavior is strong positive.
11-14-13 The first profit taking cycle is in process. There is risk to the 80-110 range. Support is building at the 120-140 range. Utilize hard short term pull back to establish first and partial position. |
| Report Graph: |
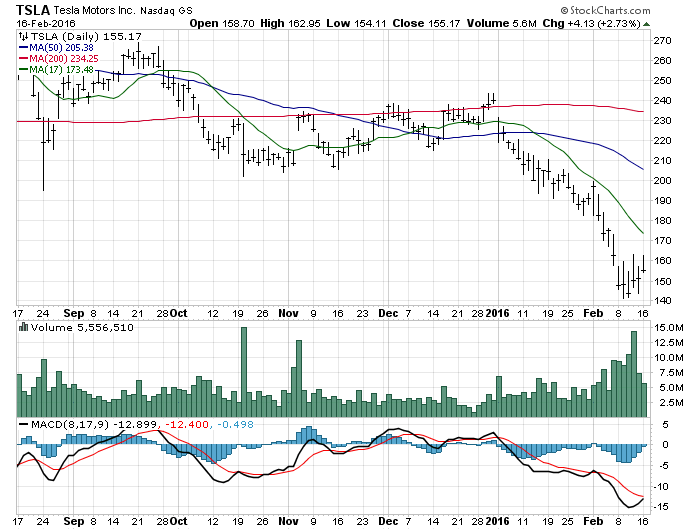
Click to Enlarge |