| Basic Details |
| Stock: |
Mannkind |
| Symbol: |
MNKD |
| Current Price: |
$6.36 |
| Current Trend: |
Upside breakout condition |
| Recommended Action: |
buy at 5-6.50 range |
| Price Target: |
$8-12 range |
| Other Details: |
4-23-14 Hot Stock closed: Upside target met(4.75-8.00)68% profit. The long term positive convergence is confirmed with long term upside to the 8-12 range. New long opened at 6.36. Accumulate at 4-6.50 range.
3-30-14 Hot Stock update(4.75): Downside buy target met on hard lean at 4.75 along the 510 axis. This appears to be the final lean on the stock.
3-5-14 Hot Stock update: Upside target met(5.69-6.65)17% profit on Hot Stock and (3.22-6.65)107% profit on original buy. Upside resistance met at the 6.65 range. A long term FTF formation is developing with continued upside to the 6.50-9 range.
2-10-14 Hot Stock initiated(5.69): A FTF formation and upside breakout condition are present. Long term upside to the 8-12 range.
12-13-11 Slope formation is negative and long term behavior is shifting positive indicating a final downside lean condition. Buy in low 2 range.
11-17-11 Upside target met(3-3.29)10% profit. Re establish long at 3.22 today. A FTF formation and positive slope shift are indicated.
10-24-11 Downside buy target met at 3.00...Slope formation remains negative and risk remains to the 2.25-2.50 range. Sell at 3.25-3.50 and make new decision.
10-2-11 Upside target met(3-3.95)32% profit. Long term behavior remains negative, but the slope formation is slowly shifting positive.
9-7-11 slope formation is shifting positive. a positive convergence is forming increasing upside pressure.
8-13-11 The hard downside completed and set a bottom at 2.20. Downside buy target met at 3. sell on bounce to the 3-4 range.
7-21-11 Early signs of a bottom formation are developing. Utilize final pull back to buy at the 3-3.5 range.
6-28-11 Upside target met(3.96-4.30)9% profit. Slope formation is shifting slightly positive. Accumulate at 3.5-3.90 range.
6-5-11 Downside pressure is diminishing. Buy at 3.5-3.99. Long term slope is shifting positive. Longer term upside is to the 5-7 range.
5-10-11 Upside target met(3.50-4.55)30% profit. A gap down formation is in place. Buy at 3-3.5 on final downside lean.
4-15-11 The bottoming cycle has not completed. A final downside lean to the 2.5-3.0 range remains at risk.
3-22-11 Downside buy target met. Bottom cycle is completing. Buy at the 2.5-3.5 range.
2-25-11 Final downside lean is completing. Buy at 2.5-3.5 on this final lean.
2-3-11 Downside buy target met below 5. Play short term bounce to the 5.50-6.50 range and make new decision.
1-23-11 A significant FTS formation is in place. Buy on final lean to the 4 to low 5 range and play bounce to the 6-6.50 range.
11-1-10 Upside target met(6.76-7.20)7% profit.
10-10-10 PRo17 indicates a positive convergence and new buy signal.
9-16-10 Pro17 indicates upside target met (5.75-6.55)14% profit on recent buy and 23% loss on long term position. A secondary FTS is in place. Buy on final pull back to the 5-5.5 range.
9-3-10 Pro17 indicates a long term bottom formation is nearly complete. Accumulate at the 5-5.75 range. The negative convergence maintains short term downside pressure.
5-11-10 Pro17 indicates downside buy target met below 6. A bottom reversal formation is indicated. However, a long term negative convergence is in place keeping downside pressure on the stock. Lock in profit at the 7.25-8 range.
4-18-10 Pro17 indicates downside buy target met at 6.5(8.50-6.50)/2=7.50 average cost. The bottoming formation is still developing. A mini FTS is in place at 7.25. Buy on hard pull back to the 5-6 range.
3-23-10 Pro17 indicates a massive FTS formation at the 10.50 range. Buy at the 5.5-6.5 range to average cost. close long position at the 8-8.5 range..
3-1-10 Pro17 indicates downside buy target met below 8.5. A FTF formation is in place and a positive breakout is indicated.
2-3-10 PRo17 indicates a peaking formation and short term pull back to the 8-8.70 range. Buy on this pull back. Long term behavior and slope formation is strong positive.
1-12-10 PRo17 indicates a short term peak formation with an underlying long term positive behavior convergence in place building upside support at the 6.5-7 range. Last forecast target met(7.25-12)66% profit.
6-8-09 Pro17 indicates an upside breakout formation. all slopes are positive and a long term positive behavioral convergence is supporting a continued upside move.
Best case upside is the 12-14 range over next 2 cycles. |
| Report Graph: |
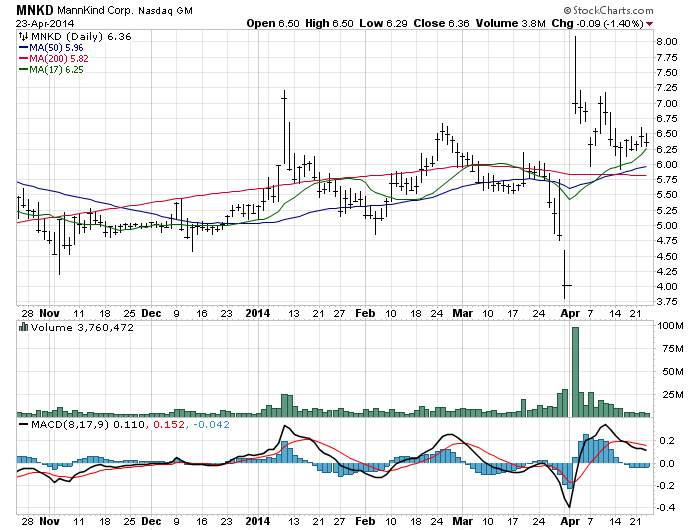
Click to Enlarge |